LVE (Lightweight Virtualized Environment) technology is similar to virtualization that takes place at a classic VPS server and allows the isolation of users to achieve better security and stability around the shared hosting servers.
In this way it is isolating the user accounts where each user (account) can manage its part of allocated resources.
To prevent misuse of servers and damage to other users accounts, LVE limits the number of input process on the web server. When problematic user (problematic, accidentally or intentionally) reaches a critical number of connections, user is automatically blocked for all new connections and server returns a 508 (Resource Limit Is Reached) for visitor of user site. In this way LVE protects all other users, while user who has reached the limit will be able to continue normal operation as soon as his account freed some connections.
Monitoring the use of resources at shared hosting directly from cPanel
We recommend you to usage and utilization of the resources that are allocated to your hosting account monitor directly from cPanel.
This monitoring can be performed in real time (current) or for a specific period. If you want to see which achieves load your account at the time when you are in cPanel you can easily follow the panel on the right side:
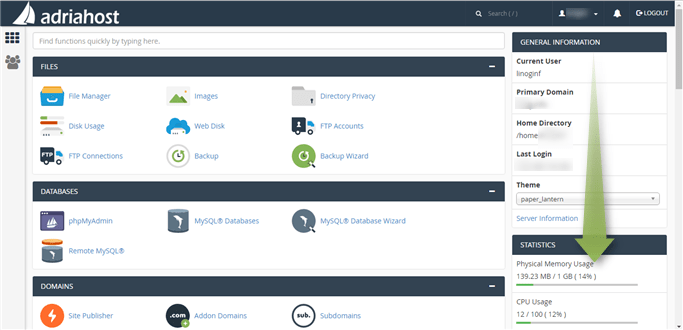
Better insight for certain period of time, you can see if the Search box, type "cpu" and click on application CPU and Concurrent Connection Usage.
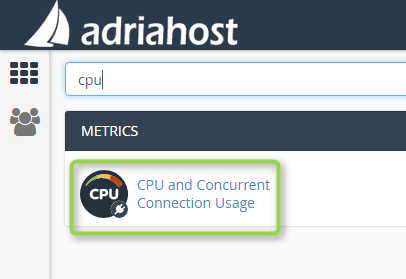
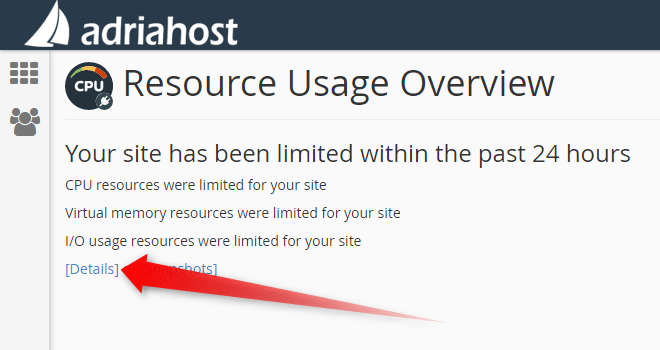
In the next screen that opens, click on the Details:
In the next screen, select the period for review from the field Timeframe:
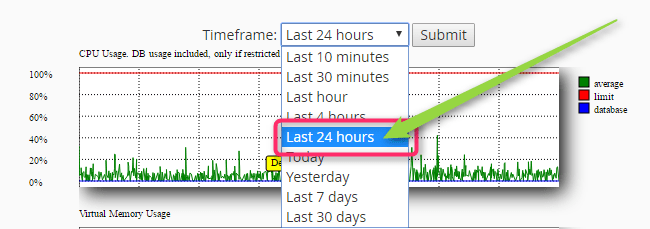
Click Submit to view the load which was achieved during the selected period:
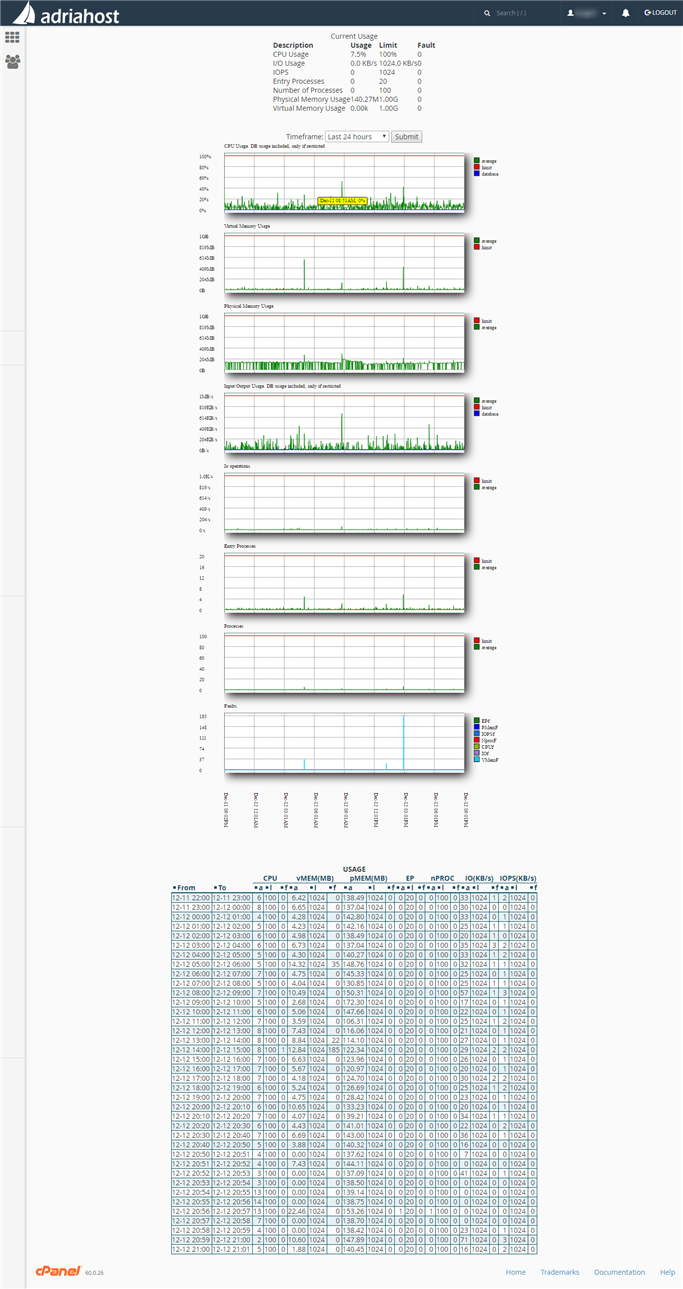
The red line in the graph indicates the limit line. The blue line indicates the maximum value reached. The green line indicates the average value and occurs when the maximum value is constant over a some period of time.
The graph Faults can be seen only when value exceeding, respectively, reaching restrictions. In this chart, each color is reserved for a particular hardware resource.
The values in the chart Faults displayed by numbers that indicate how many times a particular request could not be performed due to resource limits achieving at shared hosting.
If this number is not too large (if not comes with hundreds, thousands) probably is not a big problem, but it is a signal that you will soon need to plan specific improvement in terms of your site and maintenance.
The solution in the case of a large and constant load that site achieves
If the numbers in the chart express Faults hundreds or thousands and occur on a daily basis, it means that your site have a problems that can be solved in two ways:
1. Site Optimization - You need to review your site, and determine where the problem arises, that is, where the most resources spent. You can do this in cooperation with the person who created your website or with the person who maintains your site and is familiar with its functions. The problem occurs when the site scripts are not optimized and spending a lot more resources than is really necessary. Optimization means to adapt the script to consume only the necessary resources or that they do not spend unless it is necessary.
2. Moving to VPS service or Dedicated server - If your site is already optimized, but there are a large number of visitors and a large number of queries to the server processes that need to be made, the decision to promote your business is to move to a separate server. Also, if you do not have time to optimize, or you want to pre-enable your site by increasing resources that will have, you can switch to these services and choose a stronger configuration than the one that is on the shared hosting servers. Offer of our services can be found on the pages we have listed below:


